http://www.batonrougerealestatetrends.net/ – Baton Rouge Fore closure Trends: Where Are The 2010 East Baton Rouge Fore closures Taking Place?
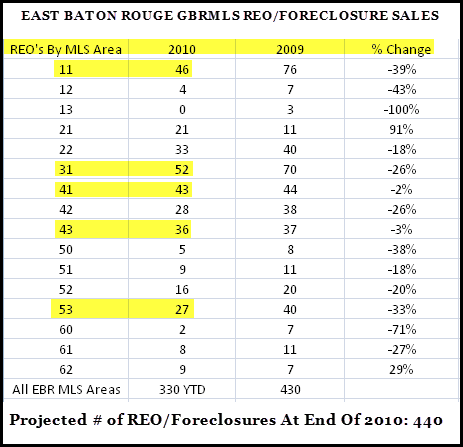
East Baton Rouge 2009 2010 Fore closure Sales Numbers! 2010 Fore closures total 12% of sales YTD; 2009 Fore closures totaled 11%. 7% of all EBR MLS Listings are Fore closures! Fore closures are negatively impacting this market. There’s A Major “Caveat” with the numbers below!
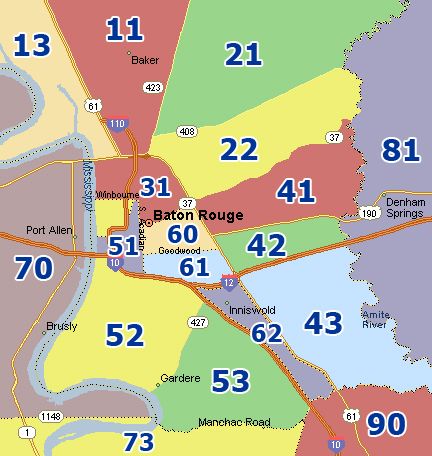
The answer is in the chart below: Areas 11, 31, 41, 43 & 53.
AREA 11 FORECLOSURES, Primarily Baker. In Area 11 in 2010, there have been 33 solds in Baker and 13 in Zachary. In 2009 and 2010, the Baker market has experienced a significant amount of fore closure activity as it was one of the markets where real estate investors flipped houses at high prices to post Hurricane Katrina buyers. Fore closure activity is cyclical in the Baker market, just as it is in the other troubled lower priced markets in Areas 31, 41 and 53. So, the fact that Baker is a higher than average REO market is no surprise to this appraiser.
In Baker, the subdivisions experiencing the higher percentage of fore closure sales were Baker Estates, Baker Heights, Baker Hills, Baker Lots & Acres and Brown Heights. In Zachary, the subdivisions experiencing the higher percentage of fore closure sales were Oak Shadows, Castle Place, Deer Park and The Cottages AT Blue Heron Lakes – those expensive town homes, expensive for the Zachary market.
AREA 31 FORECLOSURES (70802 & 70805). In Area 31 since 2008, there has been a significant amount of fore closure activity in the 30%+ of total sales range as it was one of the markets where real estate investors flipped houses at high prices to post Hurricane Katrina buyers.
AREA 41 FORECLOSURES (Park Forest Area). In Area 41 since 2008, there has been a significant amount of fore closure activity broadly throughout this market. In Area 41, the subdivisions experiencing the higher percentage of fore closure sales were Forest Oaks, Park Forest, Park Forest East, Villa Del Rey (9 reo sales in 2010) and Windsor Place.
AREA 43 FORECLOSURES (Some Surprises). A higher fore closure rate in Area 43 is an example of how this is a different market downturn than in the 1980s and 1990s. In this downturn after the mortgage meltdown, the fore closure activity AND FUTURE LOCAL FORECLOSURE ACTIVITY are located in ALL income brackets throughout all of Greater Baton Rouge. Hurricane Katrina may have been a blessing for sellers in 2005 and 2006, but some of the resales at lower than purchased prices and some of the resulting fore closures are a part of the 12% REO solds rate for EBRP.
In Area 43, the subdivisions experiencing the higher percentage of fore closure sales were High Point, Lake At White Oak (a surprise, higher priced homes), O’Neal Place (no surprise), Old Jefferson (no surprise), Shenandoah (a surprise) and higher priced Condos in Windsor Village (no surprise in the over supplied Baton Rouge Condo market and some of these condos were marketed to and sold to California investors who are now giving these back to the the banks possibly because of challenges with the California market now).
AREA 53 FORECLOSURES (1 Surprise – University Club). In Area 53 since 2008, there has been a significant amount of fore closure activity broadly throughout this market. In Area 53, the subdivisions experiencing the higher percentage of fore closure sales were Hermitage, Mayfair Park, Perkins Village, University Club Plantation (3 and very higher end homes), and Village St George.
The chart above represents the number of recorded East Baton Rouge Parish REO or Fore closure Sales within the Greater Baton Rouge MLS, with the exception of Manufactured Housing sales.
Let’s put these fore closure numbers into perspective! In 2009, there were a total of 3,985 sales. 430 fore closure sales in 2009 represents only 11% of total sales. In 2010, there were a total of 2,856 sales. 330 fore closure sales in 2010 as of 9/30/2010 represents only 12% of total sales. The projected number of reo / fore closures at end of 2010 is approximately 440.
There’s A Major “Caveat” with the numbers below! Based on a 12% REO sold rate, which does appear to be an indication REOs are negatively impacting this market. It’s also stated here that an article (The Landmines Within by Michael Tarabotto http://activerain.com/blogsview/930436/The-Landmines-Within ) stated that as much as 70% of REOs never make it into the MLS – Meaning that it might be impossible to know or state the exact # of competing REOs if they’re not being listed. MLS is reporting 203 current REO listings for all EBR MLS Areas out of a total 2,795 total listings. So, 7% of all EBR MLS Listings are Fore closures!
REO is “Real Estate Owned”!
Data used with permission of the GBRMLS. Search dates are 1/1/2009 to 10/16/2010. Extraction date was 10/16/2010. 330 REO sales for 2010 was as of 9/30/2010. As of 10/16/2010, there were 339 REO sales.
Tags: Baton Rouge Housing, Baton Rouge Housing Market, Baton Rouge Fore closure Rate, Baton Rouge REO Rate, Baton Rouge Fore closure Study