Sherwood Forest Baton Rouge La Home Prices Reach New Lows In 2012, Levels near 2004 pricing levels.
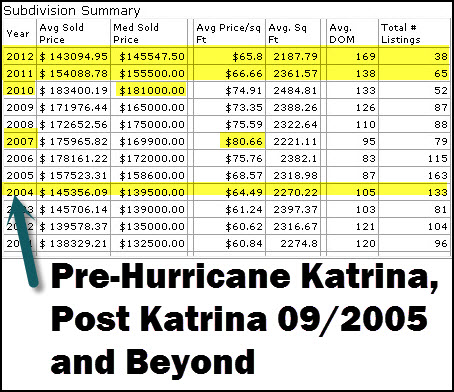
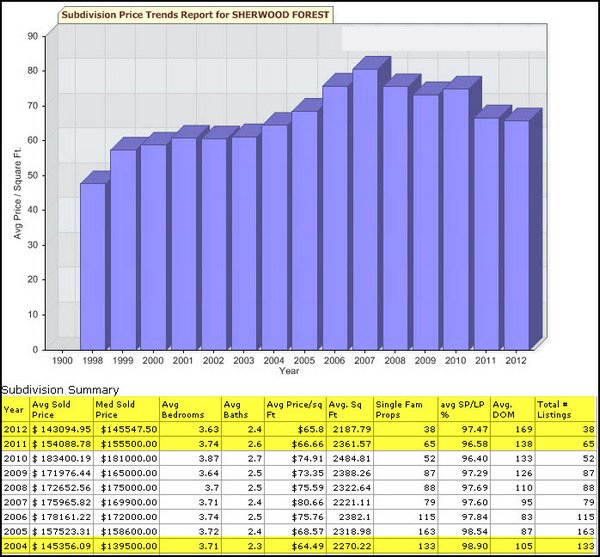
Sherwood Forest Subdivision Baton Rouge 70815 home prices have certainly taken a dive from years 2010 through 2012. After Hurricane Katrina in 08/2005, which created great demand for Greater Baton Rouge Housing, home prices rose to highs of median sales price of $172,000 in 2006 and $181,000 in 2010 and $80.66/sf in 2007. Since 2010, there’s been a steady consistent decline down to only $65.60/sf and $143,000 average sales price and $145,500 median sales price in 2012 based on 38 sales. 38 Sales represents a very solid trend! So, the median sales price has fallen -$35,452 and the average sold price per sq. ft. a whopping -$14.86/sf from the all time highs reached after Hurricane Katrina. See chart below and note that this chart is what GBRMLS says are the number of sales that have taken place as of 06/15/2012.
Why? Distressed Sales! According to GBRMLS search, of the 18 total 2012 sales or 47% were distressed in nature, 12 REOs or foreclosures and 6 Third Party sales. It’s been my experience reviewing MLS sheets that sometimes both the REO and Third Party boxes are checked, so the 18 is an estimate and it may be slightly lower.
Are some Sherwood Forest homeowners underwater on their mortgages? Some of those that purchased at the highs in 2006-2007 absolutely are!
Non-Distressed Sales. 2012 Non-Distressed Home Sales appear to average $72.74/sf, median $159,500 from $130,000 to $277,000 and average 155 days on the market. At these numbers, this is still well below post Hurricane Highs.
Sherwood Forest Housing Market Study presented by Bill Cobb and Baton Rouge Home Appraisers Accurate Valuations Group.

NOTE: Based on information from the Greater Baton Rouge Association of REALTORS®\MLS for the period of 01/01/2004 to 06/16/2012. This information was extracted on 06/16/2012. YES, this Appraiser does have the permission of GBRMLS to use the chart above Subdivision Price Trends Report!