http://www.batonrougerealestatetrends.net/ – 2010 Comprehensive Greater Baton Rouge Foreclosure Numbers and Charts Released
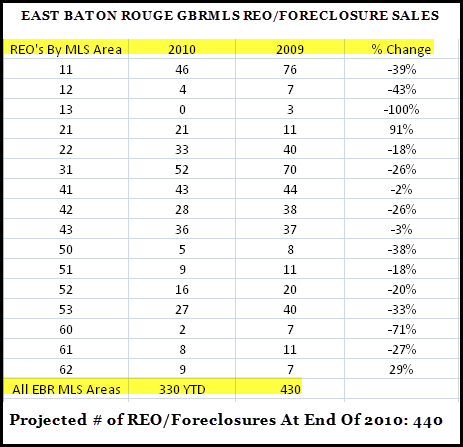
East Baton Rouge Foreclosure Trends: East Baton Rouge 2009 2010 Foreclosure Sales Numbers! 2010 Foreclosures total 12% of sales YTD; 2009 Foreclosures totaled 11%. 7% of all EBR MLS Listings are Foreclosures! Foreclosures are negatively impacting this market.
Where Are The 2010 East Baton Rouge Foreclosures Concentrated?
AREA 11 FORECLOSURES, Primarily Baker. In Area 11 in 2010, there have been 33 solds in Baker and 13 in Zachary. In 2009 and 2010, the Baker market has experienced a significant amount of fore closure activity as it was one of the markets where real estate investors flipped houses at high prices to post Hurricane Katrina buyers. Fore closure activity is cyclical in the Baker market, just as it is in the other troubled lower priced markets in Areas 31, 41 and 53. So, the fact that Baker is a higher than average REO market is no surprise to this appraiser.
In Baker, the subdivisions experiencing the higher percentage of fore closure sales were Baker Estates, Baker Heights, Baker Hills, Baker Lots & Acres and Brown Heights. In Zachary, the subdivisions experiencing the higher percentage of fore closure sales were Oak Shadows, Castle Place, Deer Park and The Cottages AT Blue Heron Lakes – those expensive town homes, expensive for the Zachary market.
AREA 31 FORECLOSURES (70802 & 70805). In Area 31 since 2008, there has been a significant amount of fore closure activity in the 30%+ of total sales range as it was one of the markets where real estate investors flipped houses at high prices to post Hurricane Katrina buyers.
AREA 41 FORECLOSURES (Park Forest Area). In Area 41 since 2008, there has been a significant amount of fore closure activity broadly throughout this market. In Area 41, the subdivisions experiencing the higher percentage of fore closure sales were Forest Oaks, Park Forest, Park Forest East, Villa Del Rey (9 reo sales in 2010) and Windsor Place.
AREA 43 FORECLOSURES (Some Surprises). A higher fore closure rate in Area 43 is an example of how this is a different market downturn than in the 1980s and 1990s. In this downturn after the mortgage meltdown, the fore closure activity AND FUTURE LOCAL FORECLOSURE ACTIVITY are located in ALL income brackets throughout all of Greater Baton Rouge. Hurricane Katrina may have been a blessing for sellers in 2005 and 2006, but some of the resales at lower than purchased prices and some of the resulting fore closures are a part of the 12% REO solds rate for EBRP.
In Area 43, the subdivisions experiencing the higher percentage of fore closure sales were High Point, Lake At White Oak (a surprise, higher priced homes), O’Neal Place (no surprise), Old Jefferson (no surprise), Shenandoah (a surprise) and higher priced Condos in Windsor Village (no surprise in the over supplied Baton Rouge Condo market and some of these condos were marketed to and sold to California investors who are now giving these back to the the banks possibly because of challenges with the California market now).
AREA 53 FORECLOSURES (1 Surprise – University Club). In Area 53 since 2008, there has been a significant amount of fore closure activity broadly throughout this market. In Area 53, the subdivisions experiencing the higher percentage of fore closure sales were Hermitage, Mayfair Park, Perkins Village, University Club Plantation (3 and very higher end homes), and Village St George.
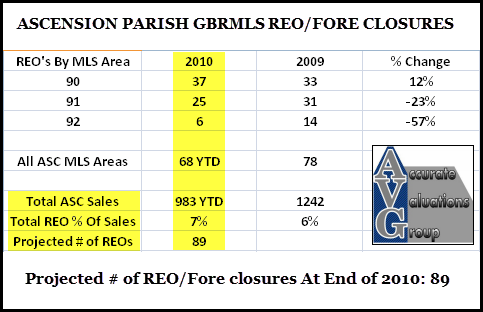
Ascension Parish Foreclosure Trends: 2009 2010 Foreclosure Sales Numbers! 2010 Foreclosures total 7% of sales YTD; 2009 Foreclosures totaled 6%, an increase of +1% since 2009. 5% of all Ascension MLS Listings are Foreclosures! Foreclosures are only moderately impacting this market.
Where Are The 2010 Ascension Parish Foreclosures Concentrated?
AREAS 90-92 2010 FORECLOSURES. In 2010, there have been 68 solds. The vast majority of these foreclosure solds were “Rural” properties (10). In restricted subdivisions, foreclosures of note were in Ascension Trace (2), Autumn Woods (2), Lakes At Dutchtown (2), Manchac Harbor (2), Oak Terrace (3) and Porte Cochere (3).
Above $200,000, Both Solds and Current Listings. The number of 2010 foreclosures that sold above $200,000 has been 19 or 28%. Out of the 46 total REO MLS listings, there are 16 current listings above $200,000 or 35%.
Above $300,000, Both Solds and Current Listings. The number of 2010 foreclosures that sold above $300,000 has been 8 or 12%. Out of the 46 total REO MLS listings, there are 3 current listings above $300,000 or 7%.
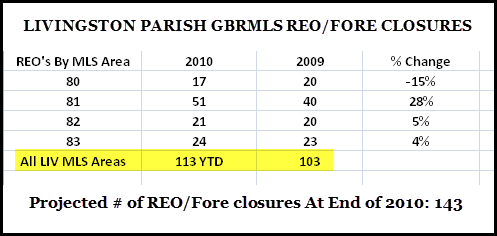
Livingston Parish Foreclosure Trends: 2009 2010 Foreclosure Sales Numbers! 2010 Foreclosures total 13% of sales YTD; 2009 Foreclosures totaled 9%, an increase of +2% since 2009. 7% of all Livingston MLS Listings are Foreclosures! Foreclosures are negatively impacting this market.
Where Are The 2010 Livingston Parish Foreclosures Concentrated?
AREA 80 2010 FORECLOSURES. In Area 80 in 2010, there have been 17 solds. The vast majority of these foreclosure solds were “Rural” properties and 3 in Three Rivers Island.
AREA 81 2010 FORECLOSURES. In Area 81 in 2010, there have been 51 solds. These foreclosures were concentrated in Acadiana Place, Easterly Lakes, Gravesbriar, Hidden Oaks Condos, Linda Lee, Richmond Place, Watson Little Farms, Wisteria Place and Wolf Creek Place. Wisteria Place is no surprise to this appraiser for a development which has experienced marketing challenges since the beginning.
AREA 82 2010 FORECLOSURES. In Area 82 in 2010, there have been 21 solds. The vast majority of these foreclosure solds were “Rural” properties and 2 in Spring Lake. There were 1 each in Lakes at Fennwood, Lakeview Acres, Live Oak Landing, North Walker Estates, Park Place, Peaks Crossing, Shalimar and Tall Oaks.
AREA 83 2010 FORECLOSURES. In Area 83 in 2010, there have been 24 solds. These foreclosures were concentrated in Forest Ridge, Plantation Park, South Point, Westminister Estates and Woodland Crossing. There were 1 each in Carter Hills, The Cove, Falconcrest, Quail Run Acres, South Haven and Stone Hill.
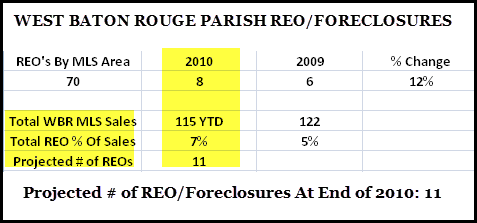
West Baton Rouge Parish Foreclosure Trends: 2009 2010 Foreclosure Sales Numbers! 2010 Foreclosures total 7% of sales YTD; 2009 Foreclosures totaled 5%, an increase of +2% since 2009. 4% of all MLS Listings are Foreclosures! Foreclosures are only moderately impacting this market.
There’s A Major “Caveat” with the numbers below! It’s also stated here that an article (The Landmines Within by Michael Tarabotto http://activerain.com/blogsview/930436/The-Landmines-Within ) stated that as much as 70% of REOs never make it into the MLS – Meaning that it might be impossible to know or state the exact # of competing REOs if they’re not being listed and that the foreclosure problem could be larger if up to 70% of REOs aren’t being listed.
REO is “Real Estate Owned”!
Data used with permission of the GBRMLS. Search dates are 1/1/2009 to 10/16/2010. Extraction date was 10/16/2010.