http://www.batonrougerealestatetrends.net/ – Baton Rouge Home Appraisals: How Market Conditions Can Mean A Not As Favorable Value For Your Home! The challenges local home appraisers now face when valuing Greater Baton Rouge homes after the Federal Tax Credit Expiration.
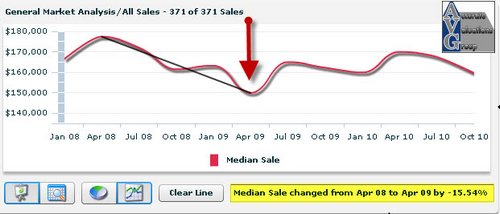
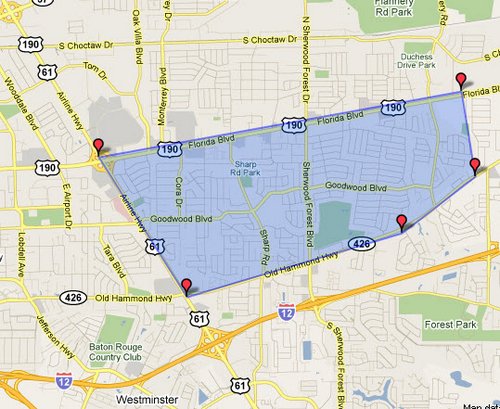
I recently completed a refinance appraisal assignment off Sharp Rd and witnessed a trend I wanted to bring your attention to. This is still the recovering Post Hurricane Gustav market of MLS Area 42, zip code 70815, generally Broadmoor and Sherwood Forest areas. I say Post Hurricane Gustav because Gustav’s damage in 9/2008 disrupted this housing market more than most realize. I believe the 2 weeks it took to restore utilities had a psychological impact on this market as home sales prices dipped, see chart below. Chart represents home sales from $100K to $300K in 70815 from 1/1/2007 to present.

As a home appraiser appraising in any local market that is now NOT always increasing every year as in prior years, it’s now crucial to know where the market has been, where it is now and where it might be in the future.
Cautions On Interpreting Market Data Post Federal Tax Credit Expiration. This post below illustrates that just because the Federal Tax Credit artificially elevated home sales and possibly home prices, doesn’t indicate an always favorable appraised value for your home. The word favorable is a favorable value in the home owner’s mind, not necessarily market reality. The areas listings inventories or homes for sale, has been building or increasing for months now while at the same time home sales have been slowing. This could be attributable to the national economy finally catching up with the local economy, more difficulty now in qualifying for a mortgage and/or the shift within the Greater Baton Rouge housing market toward more affordable housing, ie., closer to $100/sf versus $135/sf to $160/sf.


MLS Search Parameters


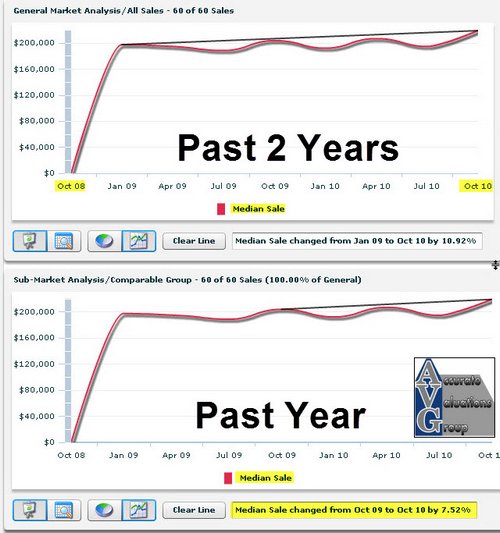
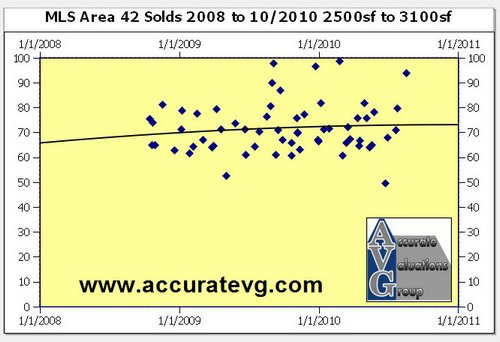
3 to 5 Bedroom Slab Homes in Area 42 Between $150,000 to $275,000, Zip Code 70815, 10/4/2008 to 10/7/2010, Ages 16-20 to Max Age, 2500sf to 3100sf.
Sold Results: Median Sales Prices!
Sold results indicate an increasing median sales price since 10/4/2008 of +11% and +7.5% over the past year.

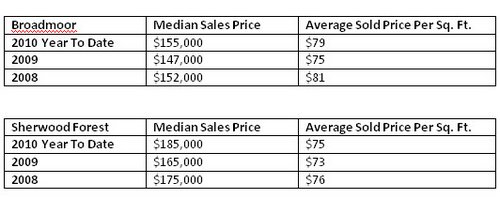
Sold Results: Average Sold Price Per Sq. Ft.!
Sold results indicate an increasing average sold price per sq. ft. since 10/4/2008. In Broadmoor, the increase has been $4/sf or +5.3%. In Sherwood Forest, the increase has been $2/sf or +2.7%.


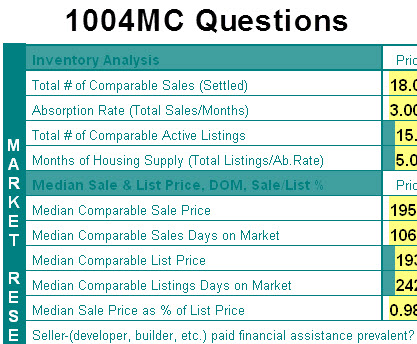
HOWEVER, The current market conditions, the Fannie Mae 1004MC or Market Conditions Form describes a different market condition THAT MUST BE ANALYZED AND RECONCILED BY THE APPRAISER.
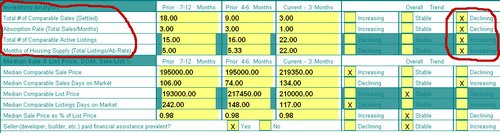

COMPETING HOME SALES ARE DECLINING – From 18 to 3!
ABSORPTION RATE IS DECLINING – From 3 Sales Per Month Down To Just 1!
TOTAL COMPARABLE ACTIVE LISTINGS IS INCREASING – Inventory Is Growing!
MONTHS OF HOUSING SUPPLY IS INCREASING – FROM 5 TO 22!

NOTE: When the top right 4 boxes are checked for Declining, Declining, Increasing and Increasing, that’s not a good market indication!
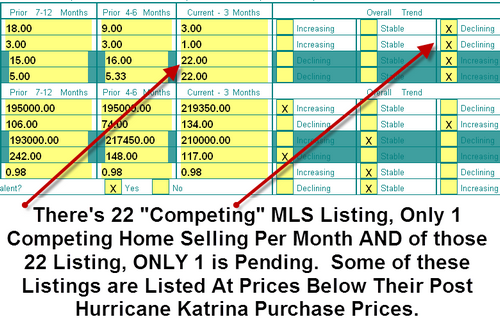

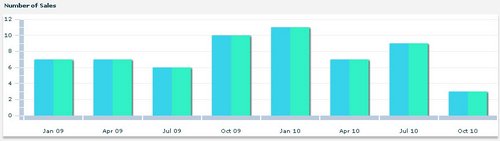
Chart Showing Slowing Home Sales!

Conclusion.
When appraising local Greater Baton Rouge Homes, it’s important for both the appraiser and the homeowner to know that ALL market conditions are examined and reconciled to arrive at a value conclusion. In the above market examination, YES, the median sales prices and average sales prices per sq. ft. were increasing, but were also still recovering. If one examines the very first chart in this post, you’ll find that this market still hasn’t fully recovered to the $180K median sales prices of 2007/2008 prior to Gustav. 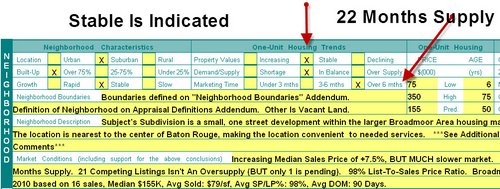

And, it’s very important to lenders underwriting the loan if there’s only 1 competing home per month selling resulting in a 22 month supply of competing housing, declining absorption rate (declining number of homes within the large inventory being removed from that inventory), increasing number of months on the market and increasing number of listings being added each month.
I do hope locals can now better understand part of the appraisal process. Home appraisals in 2010, with the newer 1004MC form and more and more requirements being added each month it seems, take much longer to complete now with much more investigation and reporting requirements.
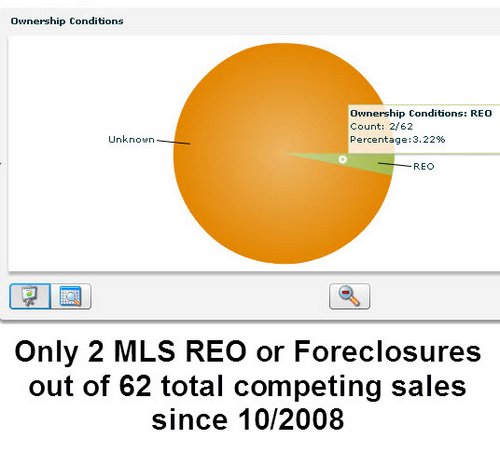
REO OR FORECLOSURE RATE!
And, for those that would like to know to know the REO or Foreclosure rate for this assignment, the chart is below showing only 2 “MLS” foreclosures for homes 2500sf to 3100sf since 10/4/2008. There could have been several more take place outside of these 2 listed in MLS as many national lenders today choose not to list their REO inventories in the MLS anymore….up to 70%. In my report, I stated, ” It’s also stated here that a recent article (The Landmines Within by Michael Tarabotto http://activerain.com/blogsview/930436/The-Landmines-Within ) stated that as much as 70% of REOs never make it into the MLS – Meaning that it might be impossible to know or state the exact # of competing REOs if
they’re not being listed. MLS is reporting 2 comparable REO listings.”


Data was used with permission of the GBRMLS, search dates 1/1/2007 to 10/07/2010, extracted on 10/7/2010.