East Baton Rouge Home Sales May 2011 vs May 2012: Solds Up 25%, Pendings Up 37%, Median Sold Price Down 3%, Months Supply of Inventory Down 38%, For Sale Properties by Month Down 10%. Complete with charting and commentary.

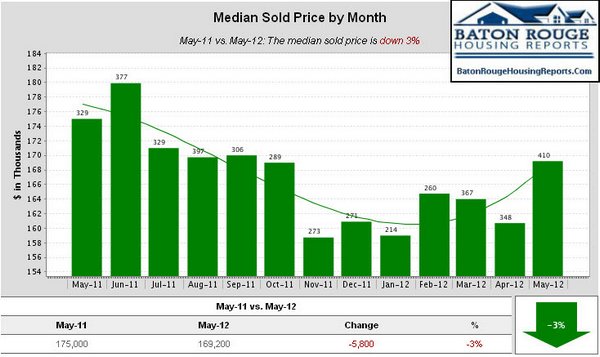
Median Sold Price by Month
May-11 vs. May-12: The median sold price is down 3%
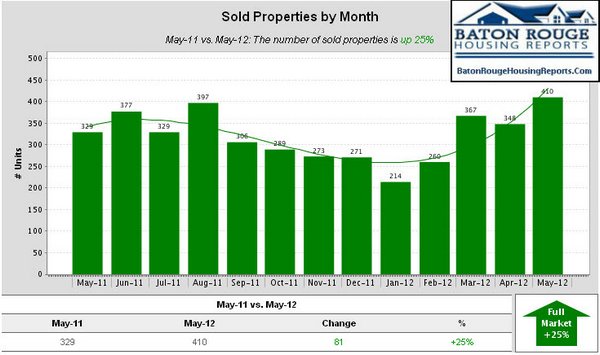
Sold Properties by Month
May-11 vs. May-12: The number of sold properties is up 25%
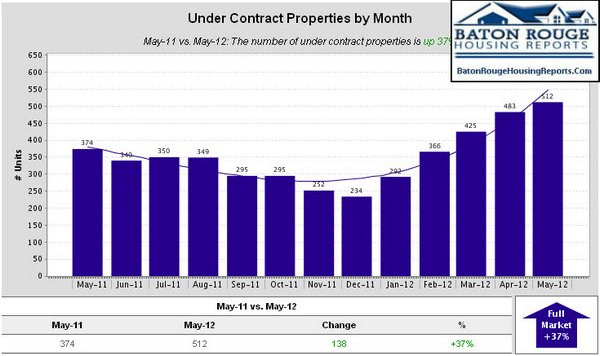
Under Contract Properties by Month
May-11 vs. May-12: The number of under contract properties is up 37%
Months Supply of Inventory
May-11 vs. May-12: The average months supply of inventory is down -38.4%
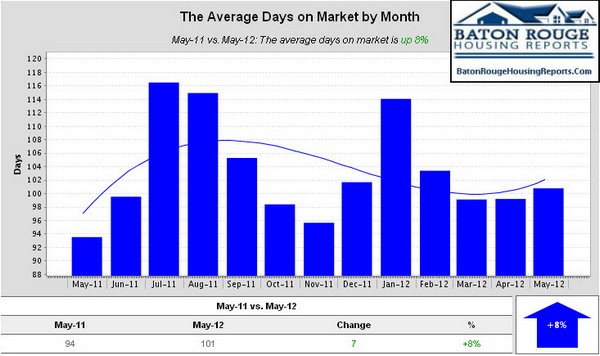
The Average Days on Market by Month
May-11 vs. May-12: The average days on market is up 8%
East Baton Rouge Parish Home Sales May 2011 vs May 2012
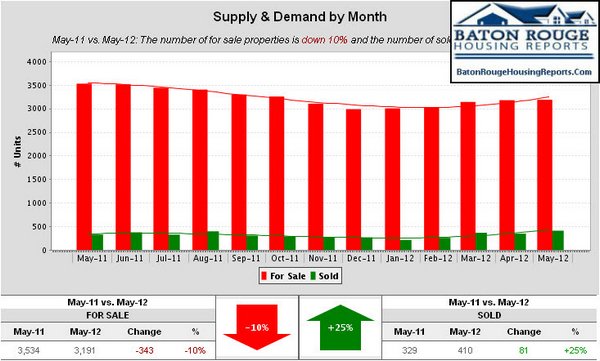
Supply & Demand by Month
May-11 vs. May-12: The number of for sale properties is down 10% and the number of sold properties is up 25%
New Properties by Month
May-11 vs. May-12: The number of new properties is up 3%
For Sale Properties by Month
May-11 vs. May-12: The number of for sale properties is down 10%
Expired Properties by Month
May-11 vs. May-12: The number of expired properties is down 10%
Median For Sale vs. Median Sold
May-11 vs. May-12: The median price of for sale properties has not changed and the median price of sold properties is down 3%
NOTE: This represents ALL GBRMLS Areas in East Baton Rouge for ALL properties and property types. Based on information from the Greater Baton Rouge Association of REALTORS®\MLS for the period of 05/01/2011 to 06/04/2012. This information was extracted on 06/05/2012.