Baton Rouge Real Estate News
Can Baton Rouge Home Buyers Receive Copy of Appraisal Report
Can Baton Rouge Home Refinancers Receive A Copy of Appraisal Report Can I Review Home Appraisal Prior To Closing? W… Baton Rouge Real Estate News‘s insight: Can Baton Rouge Home Buyers Receive Copy of Appraisal Report Can Baton Rouge Home Buyers Receive Copy of Appraisal Report Can I Review Home Appraisal Prior To Closing? […]
VIDEO: What Is A Baton Rouge Home Appraiser Final Inspection?
https://www.batonrougerealestateappraisal.com/ – What Is A Baton Rouge Home Appraisal Final Inspection? For new home construction where the home loan began whi… Baton Rouge Real Estate News‘s insight: What Is A Baton Rouge Home Appraisal Final Inspection? For new home construction where the home loan began while home was under construction, a final inspection is a […]
Baton Rouge Real Estate Appraisers have to make 700+ decisions for every Appraisal
Just in case anyone does not think an Appraisal is worth the Cost….Please take the time to read this great Article by Diana Jacobs in the Recent Worki… Baton Rouge Real Estate News‘s insight: Baton Rouge Real Estate Appraisers have to make 700+ decisions for every Appraisal Wow! I didn’t even realize this myself. […]
Which Comes First the REATLOR® or the Lender?
Which Comes First the Realtor or the Lender? Baton Rouge Real Estate News‘s insight: Which Comes First the REALTOR® or the Lender? To this Home Appraiser, based on 21 years in real estate, this is a somewhat biased article stating you should contact a REALTOR® first…..SEE NOTE BELOW. However, generally, Agents do prefer buyer(s) they’re […]
Why do Baton Rouge Home Appraisers take so long to finish the report?
You had an appraiser come out to your property last week and the appraisal is still not complete. It’s been 10 days!! What is going on? Here are some reasons why the appraisal might be taking so lo… Baton Rouge Real Estate News‘s insight: Why do Baton Rouge Home Appraisers take so long to finish […]
Baton Rouge Homeowner Spends $60K in yard, WHAT WERE THEY THINKING?
A Greater Baton Rouge Homeowner spends $60,000 in their yard on a $240,000 newer home and now they’re moving…WHAT WERE THEY THINKING? Of the $60K spent (not “invested”), home sellers may see a $10K to $15K return or a $45K loss. Baton Rouge Real Estate News‘s insight: A Greater Baton Rouge Homeowner spends $60,000 in […]
New Sky High Flood Insurance Costs Means Lost Home Sales and Declining Home Values
Many victims of Superstorm Sandy and other floods, already paying for many repairs out of their own pockets, get hit with massive flood insurance bills. Baton Rouge Real Estate News‘s insight: New Sky High Flood Insurance Costs Means Lost Home Sales and Declining Home Values. “For every $5,000 a year your flood insurance goes up, […]
Parkwood Terrace Baker LA Home Prices Report 70714 Baton Rouge
Parkwood Terrace Baker LA Home Prices Report 70714 2011-2012 Sales: 4 Sales $70,000 TO $239,500 Median Sales Price: $167,000 Avg Sold Price:$63/sf Avg SP/LP%:97% Avg Days On Market: 40 Days GBRAR MLS NOTE: Based on info from the Greater Baton Rouge Association of REALTORS®\MLS for the period of 01/01/2012 to 04/13/2013. This […]
Baton Rouge Home Appraisers: Antioch Villa Market Statistics 2012
Baton Rouge Home Appraisers: Antioch Villa Market Statistics 2012 Antioch Villa Development Antioch Villa was approved by East Baton Rouge Parish Planning and Zoning Commission April 16, 1973 and developed in mid 1970s. 2012 Antioch Villa Housing Market Statistics: 10 sales from $74,000 to $134,000, Median Sales Price $102,450, Average Sold Price $75/sf, Average Listing […]
Baton Rouge Real Estate Appraisers Report On East Baton Rouge 2012 Home Sales
Baton Rouge Real Estate Appraisers Report On East Baton Rouge 2012 Home Sales Inman News is reporting U.S. Existing-home sales near 5-year high on January 22, 2013 While EBRP Home Sales were better than 2009, 2010 and 2011, East Baton Rouge Parish home sales in 2012 WERE NOT above the 5 year high in 2008! […]
High Point Subdivision Baton Rouge Real Estate Market Statistics
High Point Subdivision Baton Rouge Real Estate Market Statistics Baton Rouge Housing Market Statistics completed by Bill Cobb Appraiser and High Point Home Appraisals Baton Rouge Baton Rouge, population 228,000 (Greater Baton Rouge Area comprising 804,000 residents). Since mid 1990s, Greater Baton Rouge experienced rapid residential and commercial development. High Point location is convenient to local schools, employment […]
Difference Between Baton Rouge Home Appraisals Versus Home Inspections
https://www.batonrougerealestateappraisal.com// – Difference Between Baton Rouge Home Appraisals Versus Home Inspections In A Mortgage Loan Process. The Home Appraiser is hired by the bank to decide the estimated market value of a house. The Appraisal Report protects the Bank or Lender and not the home buyer. The buyer pays for the home appraisal and that price will depend on if […]
Baton Rouge Home Prices: Sherwood Forest Corrects Down To 2005 Support
http://www.baton-rouge-real-estate.com/ – Baton Rouge Home Prices: Sherwood Forest Corrects Down To 2005 Support The GBRMLS Trends chart below shows a substantial home price correction taking place within Baton Rouge’s Sherwood Forest Subdivision. The Average Sold Price Per Square Foot has declined from $80.66/sf in 2007 down to $68.61/sf in 2011, back to […]
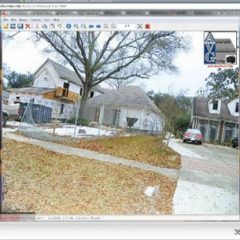
Greater Baton Rouge Real Estate Elevated Photography Services Now Available
http://www.batonrougelistingsservices.com/ – Greater Baton Rouge Real Estate Elevated Photography Services Now Available by Bill Cobb with Baton Rouge Listings Services and AVG Accurate Valuations Group! Find out more at the url above in blue. Below is a compare and contrast showing the marketing differences in perspective of home listing photo at normal elevation versus elevated […]
Can Baton Rouge Real Estate Agents Talk To Home Appraisers During A Purchase Appraisal?
Can Real Estate Agents Talk To Home Appraisers During A Purchase Appraisal? In short, they absolutely can! HVCC was retired yet the policies it set in motion remain in motion. Now, Dodd-Frank’s Appraiser-Independence Legislation is the rule of the day and there is a lot of confusion out there between both Home Appraisers and Real […]
West Baton Rouge Parish Quarterly Home Sales By Zip Code Q1 2010 versus Q1 2011 Report
http://www.batonrougerealestatetrends.net/ – West Baton Rouge Parish Quarterly Home Sales By Zip Code Q1 2010 versus Q1 2011 Report. Home Sales volume up 3.7% while correction in Average Sales Price Continues. Accurate Valuations Group (Home Appraisals) has completed an analysis of the West Baton Rouge Parish housing market from First Quarter 2010 versus First Quarter […]
Baton Rouge Real Estate Appraisal: SFREP Appraisal Software Helps Underwriter Communication
https://www.batonrougerealestateappraisal.com// – Baton Rouge Real Estate Appraisal: SFREP Appraisal Software Helps Underwriter Communication SFREP or Software for Real Estate Professionals is a local real estate appraisal software company founded by R. Wayne Pugh, MAI. SFREP recently added a new mapping feature to their “Appraise-It” product, which aids the appraiser in better communication with the […]
How To Straighten A Photo Free With Windows Live Photo Gallery
Baton Rouge Real Estate Buzz: How To Straighten A Photo Free With Windows Live Photo Gallery! In this video, Home Appraiser Bill Cobb shows how he straightened a photo for a blog post. Windows Live Photo Gallery allows one to share photos and videos online, find the photos you’re looking for and make photos look […]
Baton Rouge Real Estate Appraisers: Why do some houses sit on the market while others sell?
https://www.batonrougerealestateappraisal.com// – Baton Rouge Real Estate Appraisers: Why do some houses sit on the market while others sell? Here’s an interesting video by Jay Papasan, an executive of Keller Williams Realty. We see “Jay” on the month “This Month In Real Estate US: November 2010” videos on YouTube. In this video, Mr. Papasan explains […]
Baton Rouge Real Estate Appraisal Dot Com Three Year Study of Jefferson Crossing
https://www.batonrougerealestateappraisal.com// – Baton Rouge Real Estate Appraisal Dot Com Three Year Study of Jefferson Crossing Baton Rouge Housing Market Metrics New Three Year Study of Jefferson Crossing: Northern Ascension Parish Housing Market Metrics: Jefferson Crossing 3 Year Study